Why perform any sort of data analysis if you’re not looking at the correct data, right?
Google Analytics is the most commonly used data analysis tool to track and measure your website performance. The comprehensive range of metrics you can track, along with the usual easy-to-use Google interface, means it suits almost all website data analysis requirements. It is also free, which is a big bonus. And while I’m discussing how great Google Analytics is, lets also talk about how cool it would be to set up different dashboards to measure specific elements of your campaigns. Wait. You can!
There are two methods to setting up your custom Google Analytics dashboard: either start from scratch, or import dashboards that have already been built for you. I’ll start with the easy method and provide 5 custom dashboards for you that suit different analysis needs.
Setting up your Google Analytics dashboard: easy method
Don’t worry. It’s not cheating to import pre-built dashboards into your Google Analytics account. Don’t feel like you have to start from scratch if there is already dashboards out there that suit your exact tracking requirements.
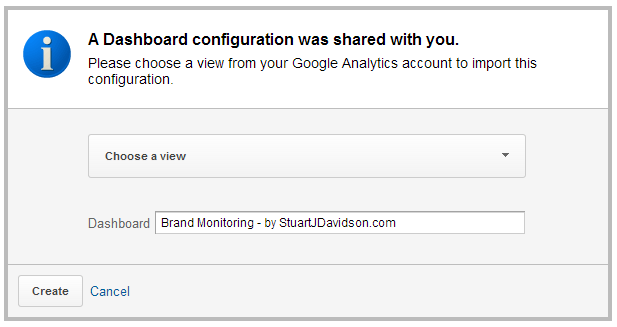
To import a custom Google Analytics dashboard from my list of 5 below, simply click on the dashboard links you like the sound of and a new page will open that navigates you to your Google Analytics account. If you haven’t already, log in and then you will see a screen that looks like this:
Click the Choose a view option and a drop-down menu will appear showing you all the domains you have linked to your Google Analytics account. Select the domain you want to import the custom Google Analytics dashboard to, rename the Google Analytics dashboard if you wish, then click Create. You should then be automatically redirected to your new Google Analytics dashboard.
That’s all there is to it. Your new Google Analytics dashboard should already be populated with data, so long as you have had Google Analytics installed already and you have data to track!
So without delay, here are 5 custom dashboards I use that you might find useful:
Social Media Dashboard
Unless you have been hiding under a rock for the past few years, you will have some knowledge of social media and some sort of presence. Social media platforms provide referral traffic - in some cases it will be the primary campaign objective to use social media to generate traffic back to the money site. So you should be aware of how well this is going. And which channels are the most effective for you.
This dashboard should provide you with enough specific data to make informed decisions on which social platforms generate the most value for you.
Download the dashboard here
SEO Dashboard
Depending on your business, search engines can generate the most amount of traffic to your website. So you should know what people are looking for when they visit your website and how they found you. This dashboard provides insights into your search traffic sources and behaviour. It can used to make decisions on how to position or optimise your website, highlighting areas such as keyword strategy implications.
Download the dashboard here
Brand Monitoring Dashboard
Probably the most critical aspect of any brand with an online presence is knowing when your brand is being mentioned and understanding the actions coming from this. Monitoring how strong your brand presence is can dictate the tactics used in your marketing campaigns. Having controls in place to recognise both positive and negative actions can position your brand perfectly to be at the forefront of feedback and discussions.
This brand monitoring dashboard shows the website traffic via branding and your most important hubs to your band.
Download the dashboard here
E-commerce Dashboard
If you’re selling anything online, then the better you use data to your advantage, the more profitable you will be. It is essential to monitor where your traffic is coming from in relation to how much revenue their generating. This dashboard is great for quickly understanding all of the most important e-commerce metrics in one window.
Download the dashboard here
Tech Dashboard
If you work in digital marketing, then at some point you will need to have somewhat of an understanding around the technology you, and your visitors, are using around your website. Being able to understand the impact of proposed changes and act accordingly will negate the trial and error periods and keep your campaigns focused.
Imagine an example where your boss doesn’t think its worth getting your website optimised for mobile when selling beauty products online. Your Google Analytics data shows that a huge percentage of your website traffic comes from a range of different mobile visitors. It also indicates that the highest goal conversion rate comes from Chrome desktop visitors. Well, this data alone already highlights that lower traffic volumes on an optimised display is producing more conversions. Presenting this is basically conclusive proof that he was wrong and that the website is missing out from not being optimised for mobile. Simples.
Download the dashboard here
Setting up your Google Analytics dashboard: from scratch
If you don’t want to use pre-built dashboard displays or require something more specific to your campaign objectives, then you can achieve the same outcome by starting a new dashboard from scratch. Here’s a quick walk-through for you:
- Log in to Google Analytics
- Select the profile for your domain
- Create a new dashboard from the left-sidebar and select a blank canvas
- Select some widgets to add and configure their metrics
And there’s more…
If these 5 custom dashboards don’t hit the mark, then you can find a number of Google Analytics dashboards in the Google’s Analytics solutions gallery.
If you have created your own dashboard and think its awesome, then please let me know so I can take a peek!


